Details
-
Bug
-
Resolution: Done
-
 Major
Major
-
1.0.0.Alpha6
-
None
Description
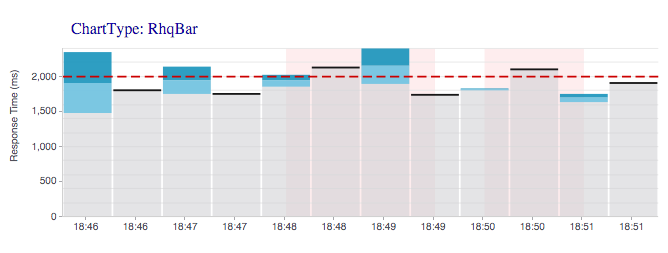
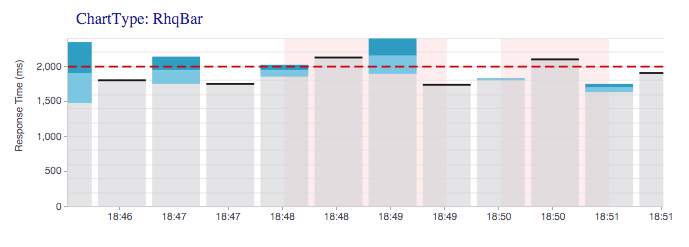
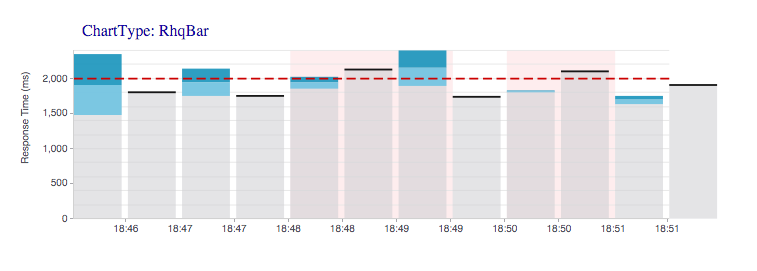
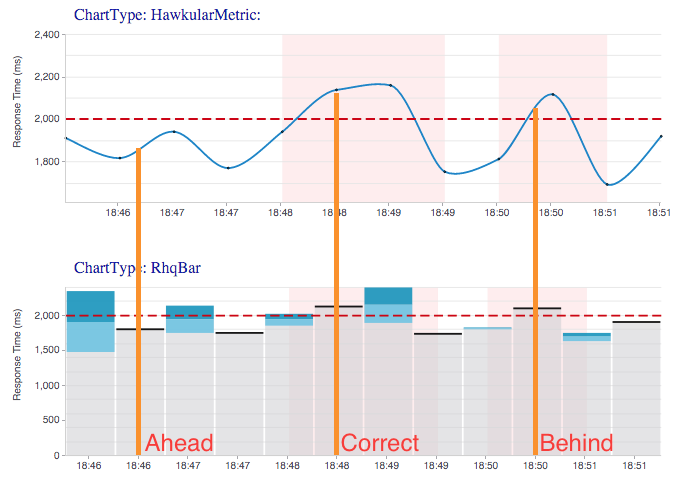
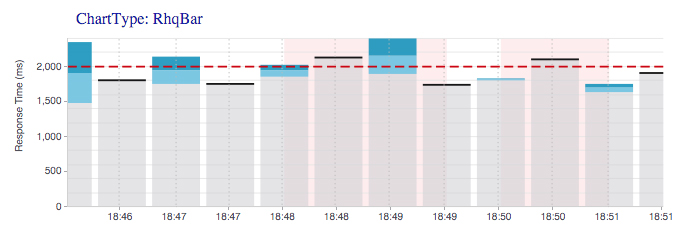
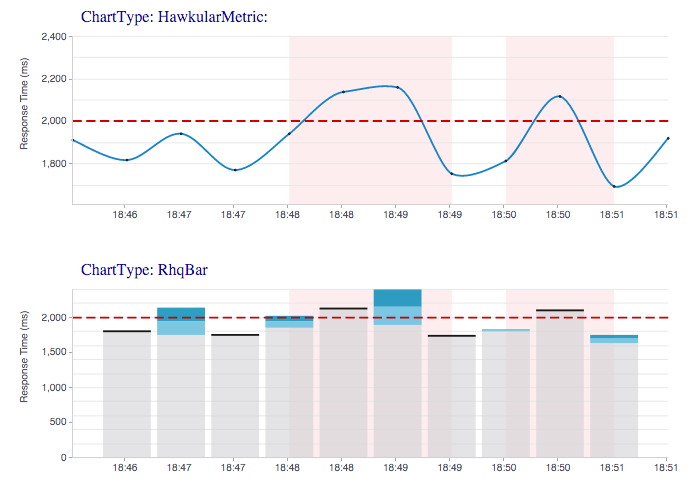
The Bar/Histogram charts are off by 1 bar, ie, there's a bar which stays out of the chart area.
This happens because the first datapoint is plotted at position x=0, but since the bar has it's [full] width it gets skewed by half a bar (as the bar should be centered on the corresponding time). All next bars are half a bar to the right, not aligned with the exact time on the scale. The same happens for the last datapoint, it goes in the very end of the chart area, but again due to bar having [full] width (contrary to lines, or dots) the right half of it is "extra" to the chart. That summed to the "extra" left half of the first bar, makes the entire last bar off.

The more bars there are the more thin they are, thus the problem showing less, when we zoom and get to larger bars, it starts to show more critical.
Possible solutions for this are:
a) Add an extra "half bar space" to begin and end of the timescale, making space for the entire bars at both edges. See OPTION_A.PNG for how it looks.
This would be the ideal solution, if we didn't needed to compare charts, thus having the same scale. See OPTION_A_PROB.PNG for the issue it may cause;

b) Plot just the half bars at begin and end. This is second best option, allowing the scale to be the same as other possible charts, but presenting "half bars" at the edges. The issue with this is what a user might interpret of a "half bar" meaning. See OPTION_B.PNG. If this is to be used, some sort of marker line may be used to give impression that the bar has been "cut".
c) Hide initial [and end] bar[s]. If only initial, it will diminish the problem to half the last bar being off, and making all the bars be aligned with their exact point in the scale. Hiding the last as well will remove the half bar off problem, but never showing the last data, which may not be desirable. It may look weird as other charts will show data for these "gaps". See OPTION_C.PNG

What option is the less bad, since there's no optimal solution having full bars, with same scale and not "losing" (hiding) data ?
Attachments


Issue Links
- relates to
-
HAWKULAR-832 Define use cases and styles for y axis grid lines in charts.
-

- Closed
-
