Uploaded image for project: 'Hawkular'
  1. Hawkular
  2. HAWKULAR-695

Charts: When all values are 0 no Y axis scale is shown

XMLWordPrintable

    • Icon: Bug Bug
    • Resolution: Done
    • Icon: Major Major
    • 1.0.0.Alpha6
    • 1.0.0.Alpha5
    • User Interface
    • None

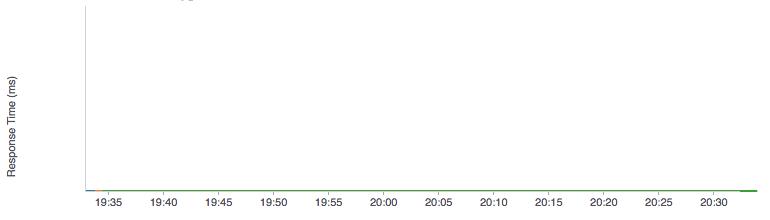
      When all the values from a chart are 0, no y scale is shown, although the 0 value line(s) are drawn (see screenshot). It should fallback to a default scale, so at least is known that the value observed is 0.

            alexandrem_jira Alexandre Mendonça (Inactive)
            alexandrem_jira Alexandre Mendonça (Inactive)
            Votes:
            0 Vote for this issue
            Watchers:
            1 Start watching this issue

              Created:
              Updated:
              Resolved: