Uploaded image for project: 'Hawkular'
  1. Hawkular
  2. HAWKULAR-361

Optionally use different scale for RT charts

XMLWordPrintable

    • Icon: Enhancement Enhancement
    • Resolution: Obsolete
    • Icon: Major Major
    • None
    • 1.0.0.Alpha1
    • User Interface
    • None

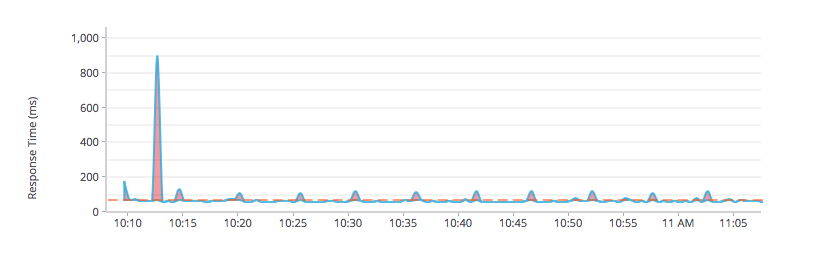
      In attached chart, the low values that make up 98% of the data points are not really "visible", as the chart is honoring the large value to fit in.

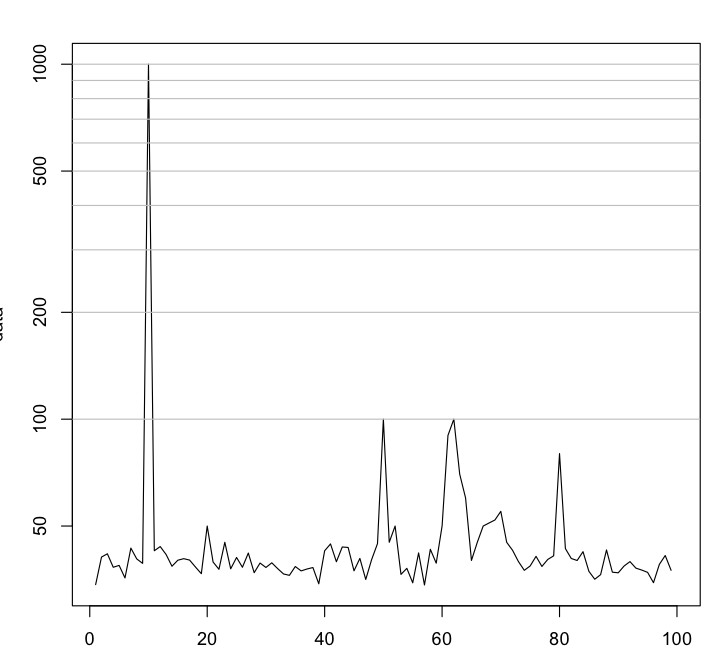
      We should consider other ways to represent the y-axis scale

      • logarithmic
      • dis-continued (show 0-200, then some // mark and then 800-1000 range again
      • ...

        1. Bildschirmfoto 2015-06-17 um 11.08.05.png
          27 kB
          Heiko Rupp
        2. Bildschirmfoto 2015-06-17 um 11.43.43.png
          30 kB
          Heiko Rupp
        3. Bildschirmfoto 2015-06-17 um 11.43.53.png
          41 kB
          Heiko Rupp
        4. Bildschirmfoto 2015-06-17 um 20.48.45.png
          39 kB
          Heiko Rupp
        5. Bildschirmfoto-redo.jpg
          30 kB
          Elizabeth Clayton

            mithomps1@redhat.com Mike Thompson (Inactive)
            pilhuhn Heiko Rupp
            Votes:
            0 Vote for this issue
            Watchers:
            2 Start watching this issue

              Created:
              Updated:
              Resolved: