Uploaded image for project: 'Red Hat OpenShift Dev Spaces (formerly CodeReady Workspaces) '
  1. Red Hat OpenShift Dev Spaces (formerly CodeReady Workspaces)
  2. CRW-3563

Debugging the .NET sample with Dev Spaces default image (UDI) doesn't work (it works with a custom image)

XMLWordPrintable

    • True
    • Hide
      UDI image should be updated to ubi9.
      Depends on https://issues.redhat.com/browse/CRW-3185
      Show
      UDI image should be updated to ubi9. Depends on https://issues.redhat.com/browse/CRW-3185
    • False
    • Release Notes
    • Hide
      = Debugger does not work in the .NET sample

      Currently, the debugger in Microsoft Visual Studio Code - Open Source does not work in the .NET sample.

      .Workaround

      * Use a different image from the following sources:

      ** link:https://issues.redhat.com/secure/attachment/13065853/Dockerfile-1[Custom UBI-9 based Dockerfile]

      ** link:https://issues.redhat.com/secure/attachment/13065852/devfile-1.yaml[devfile.yaml]
      Show
      = Debugger does not work in the .NET sample Currently, the debugger in Microsoft Visual Studio Code - Open Source does not work in the .NET sample. .Workaround * Use a different image from the following sources: ** link: https://issues.redhat.com/secure/attachment/13065853/Dockerfile-1 [Custom UBI-9 based Dockerfile] ** link: https://issues.redhat.com/secure/attachment/13065852/devfile-1.yaml [devfile.yaml]
    • Known Issue
    • Done
    • Release Notes

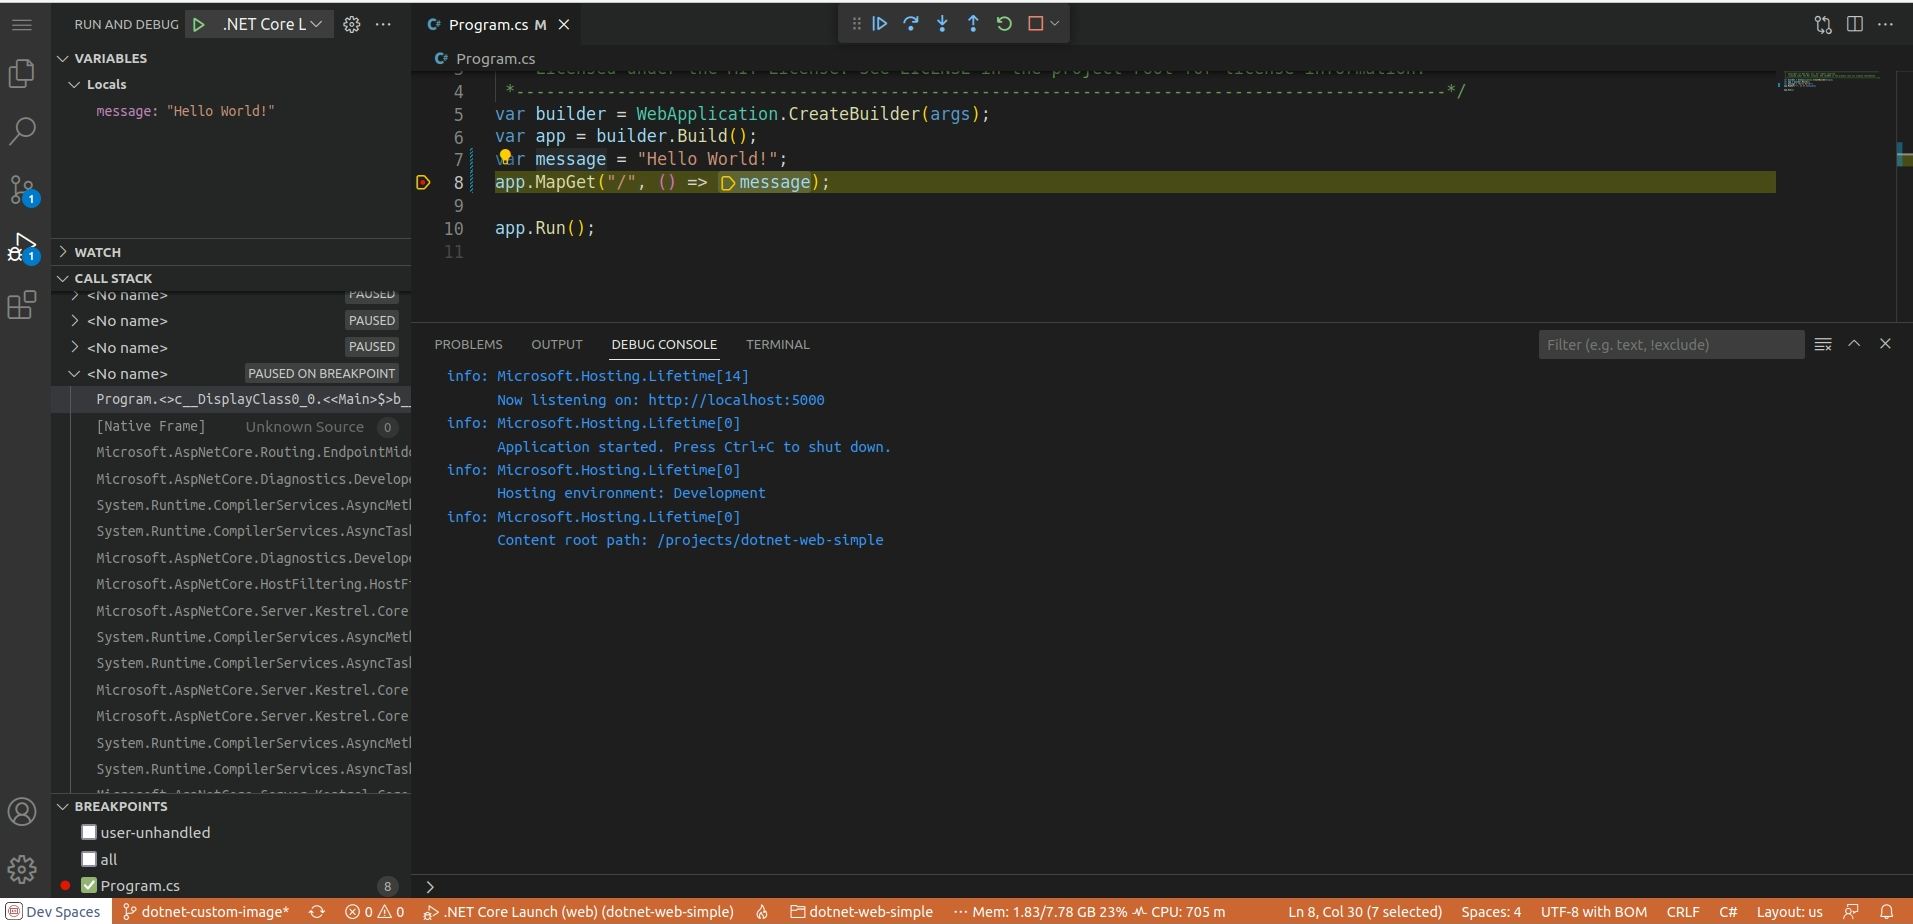
      Description of problem:

      It's not possible to run any debug configuration in the .NET sample

      Steps to Reproduce

      1. Create a workspace from dotnet sample
      2. Select any debug configuration in the Debug view
      3. Try to run the debugger

      Actual results:

      The debugger should run

      Expected results:

      The debugger doesn't run

      Reproducibility (Always/Intermittent/Only Once):

      Always

      Additional info (Such as Logs, Screenshots, etc):

      After quick investigation no related logs in the browser console and Output view. Tested the same sample with the same VS Code extension on gitpod.io and the debugger worked.

      The debug functionality is provided by muhammad-sammy.csharp VS Code extension


      Screencast: screencast-devspaces.apps.ocp410.crw-qe.com-2022.11.25-12_04_58.mp4

            vsvydenk Valerii Svydenko
            vsvydenk Valerii Svydenko
            Max Leonov Max Leonov
            Votes:
            0 Vote for this issue
            Watchers:
            10 Start watching this issue

              Created:
              Updated: