Uploaded image for project: 'Red Hat 3scale API Management'
  1. Red Hat 3scale API Management
  2. THREESCALE-1241

Analytics monthly view shows incorrect dates as month end

    XMLWordPrintable

Details

    • Hide

      I was able to reproduce this by setting the timezone in my account to UTC. If you look at the original screenshot you can see the first plot on the graph is for the 1st March and the second plot is 28th March, this is incorrect. It seems like usage from the month previous is then being displayed in the first plot and this is evident when you check the CSV, the total is greater than that shown in the analytics graph 10.6B requests vs 12.34B, also it looks like the CSV is dropping some zeroes in the generated numbers.

      Show
      I was able to reproduce this by setting the timezone in my account to UTC. If you look at the original screenshot you can see the first plot on the graph is for the 1st March and the second plot is 28th March, this is incorrect. It seems like usage from the month previous is then being displayed in the first plot and this is evident when you check the CSV , the total is greater than that shown in the analytics graph 10.6B requests vs 12.34B, also it looks like the CSV is dropping some zeroes in the generated numbers.

    Description

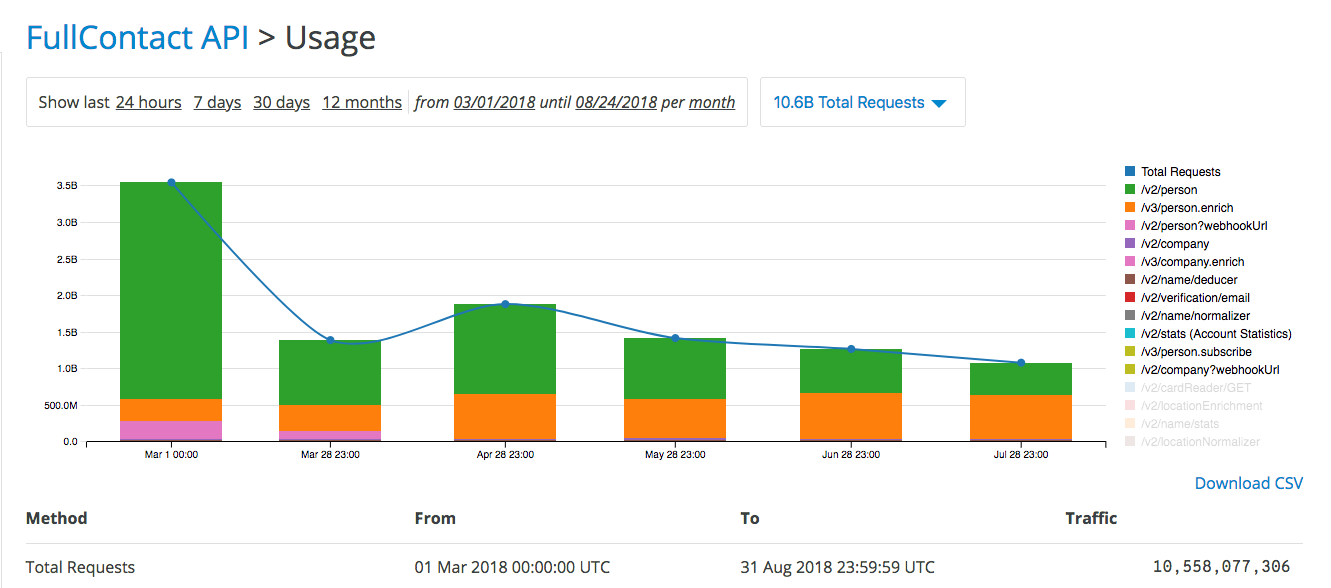
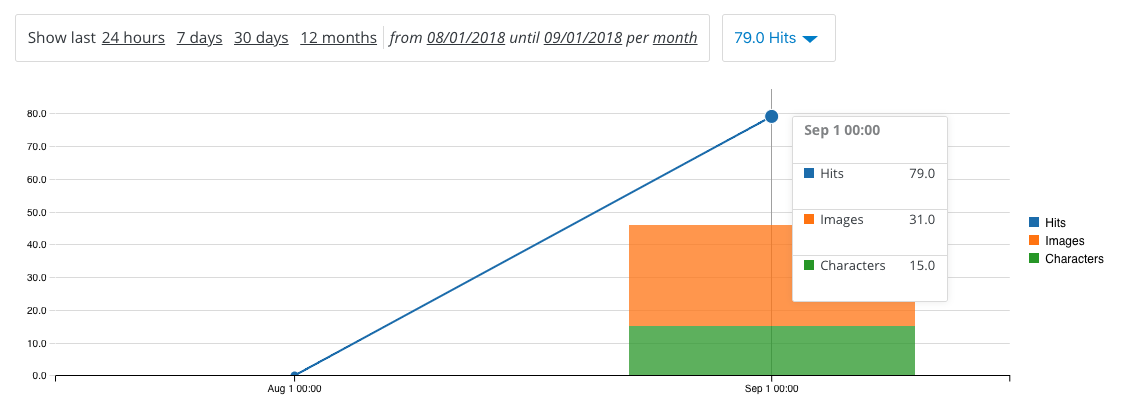
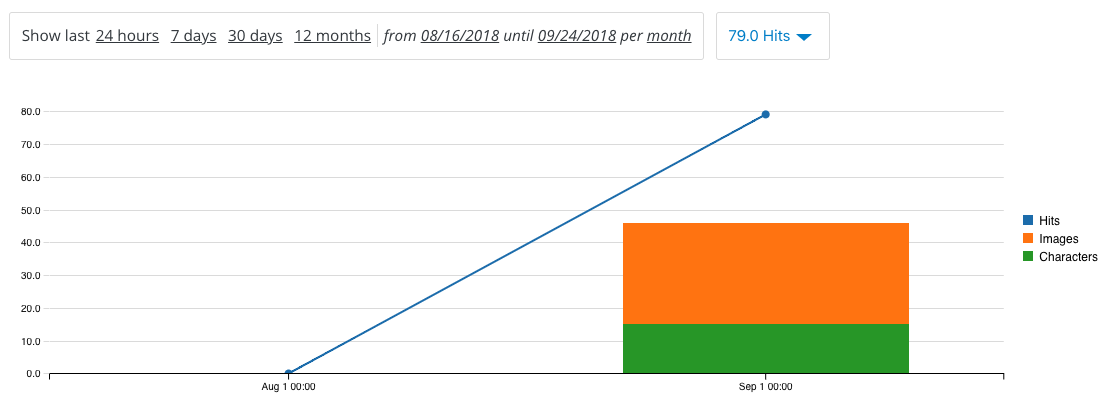
      The view as shown in the screenshot is displaying usage for a defined range of dates with the period set to month. The dates underneath each month on the X-axis should show the months' end date but they are in fact displaying incorrectly.

      The issue arises only when setting the timezone in the admin portal to UTC.

      Attachments

        Issue Links

          Activity

            People

              Unassigned Unassigned
              rhn-support-keprice Kevin Price
              Votes:
              0 Vote for this issue
              Watchers:
              3 Start watching this issue

              Dates

                Created:
                Updated: