Details
-
Enhancement
-
Resolution: Cannot Reproduce
-
 Minor
Minor
-
None
-
7.0.0.Beta1
-
NEW
-
NEW
Description
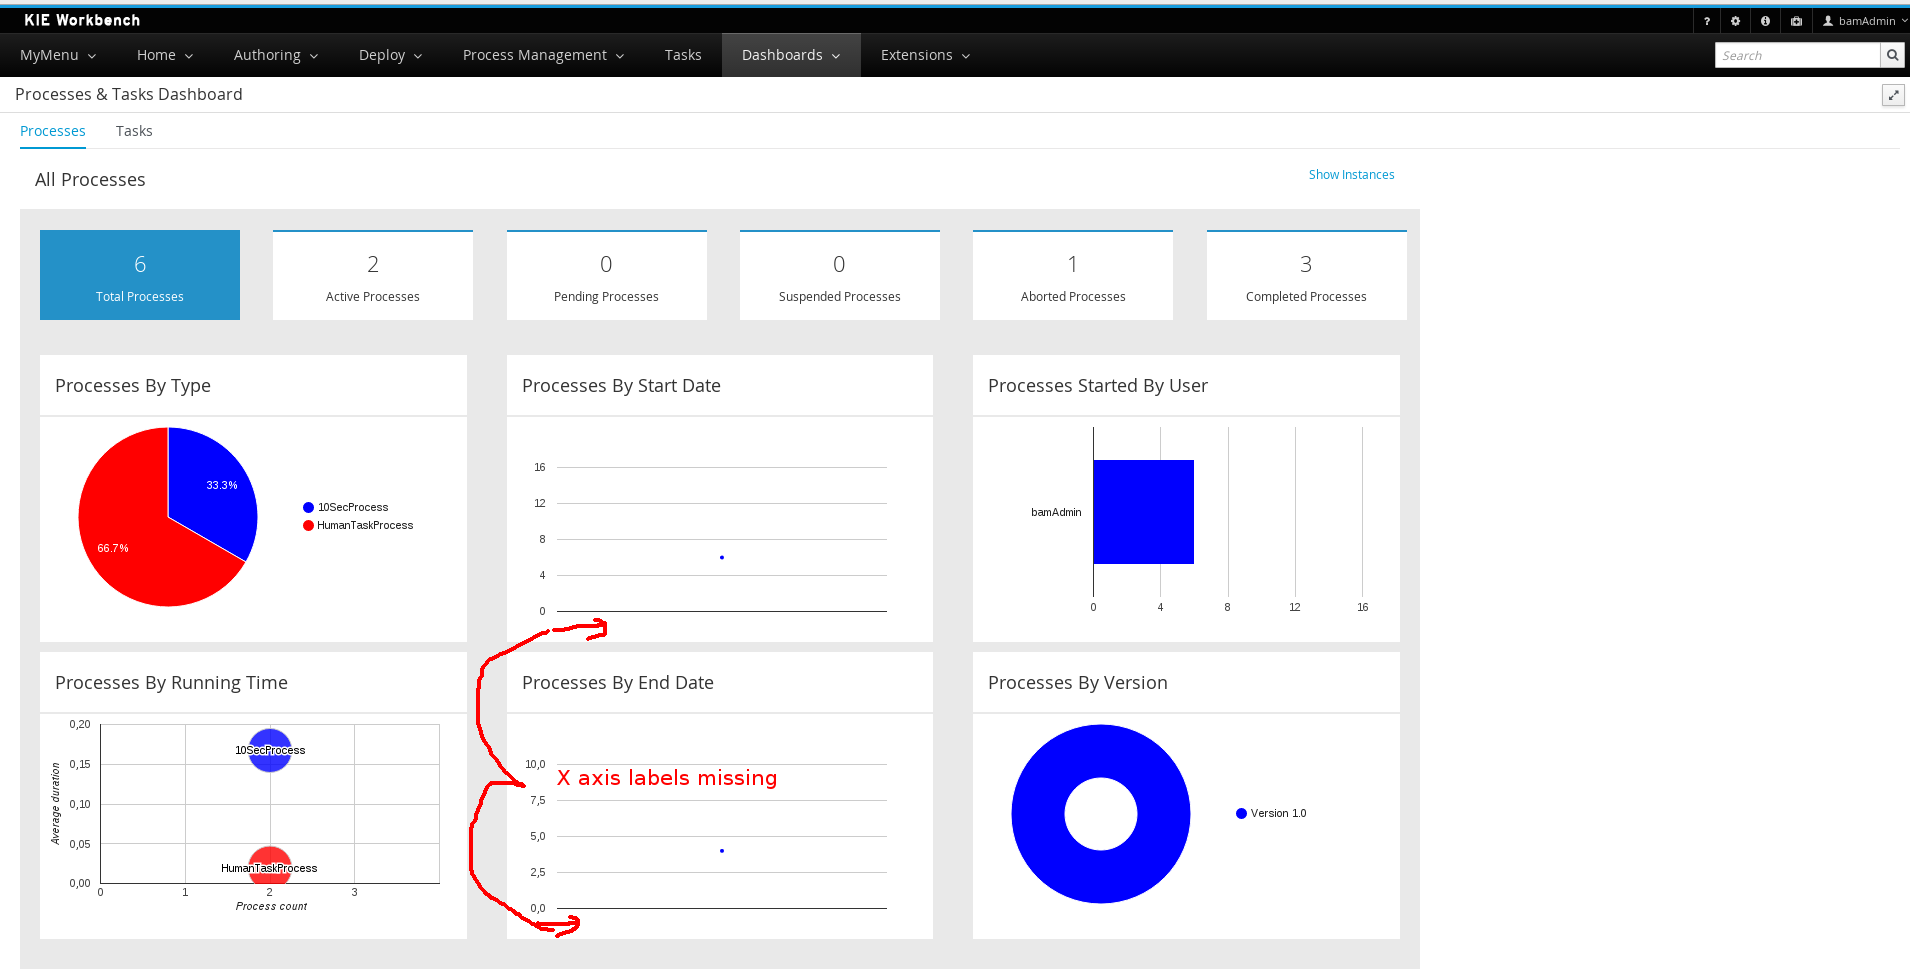
Could you please enable X Axis labels for charts:
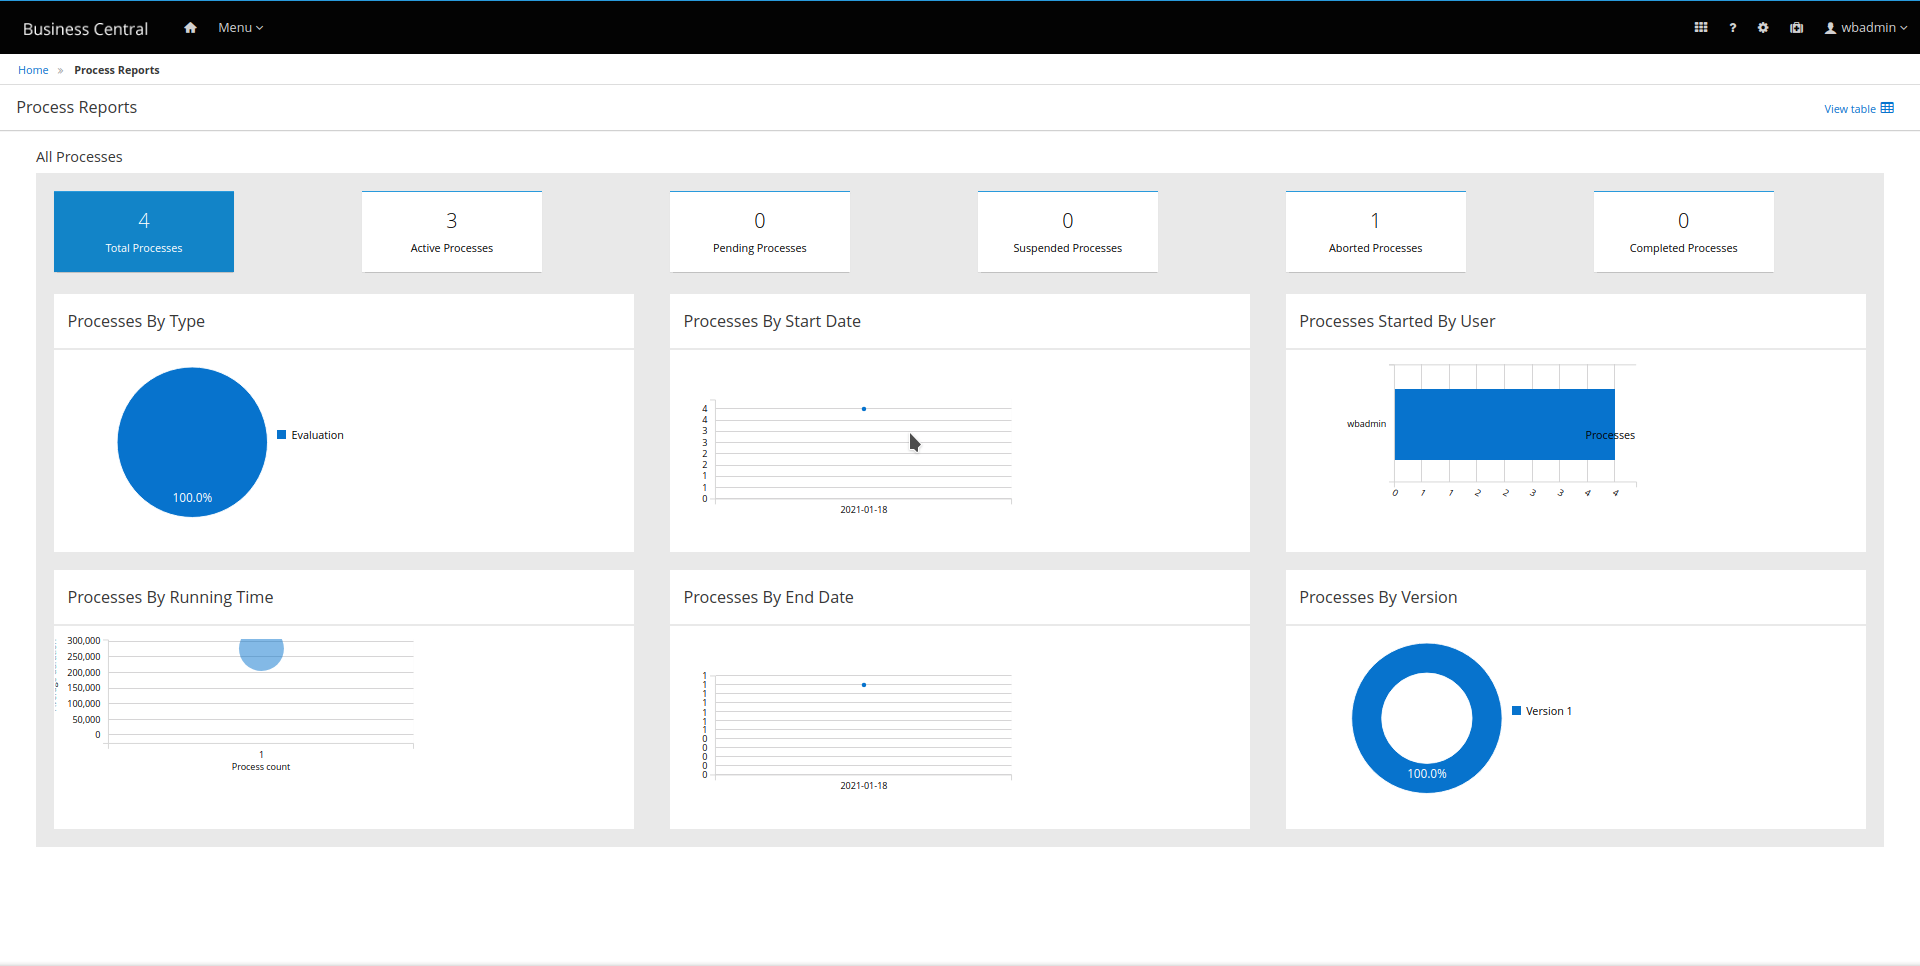
1. in Process dashboard
a. Processes by start date
b. Processes by end date
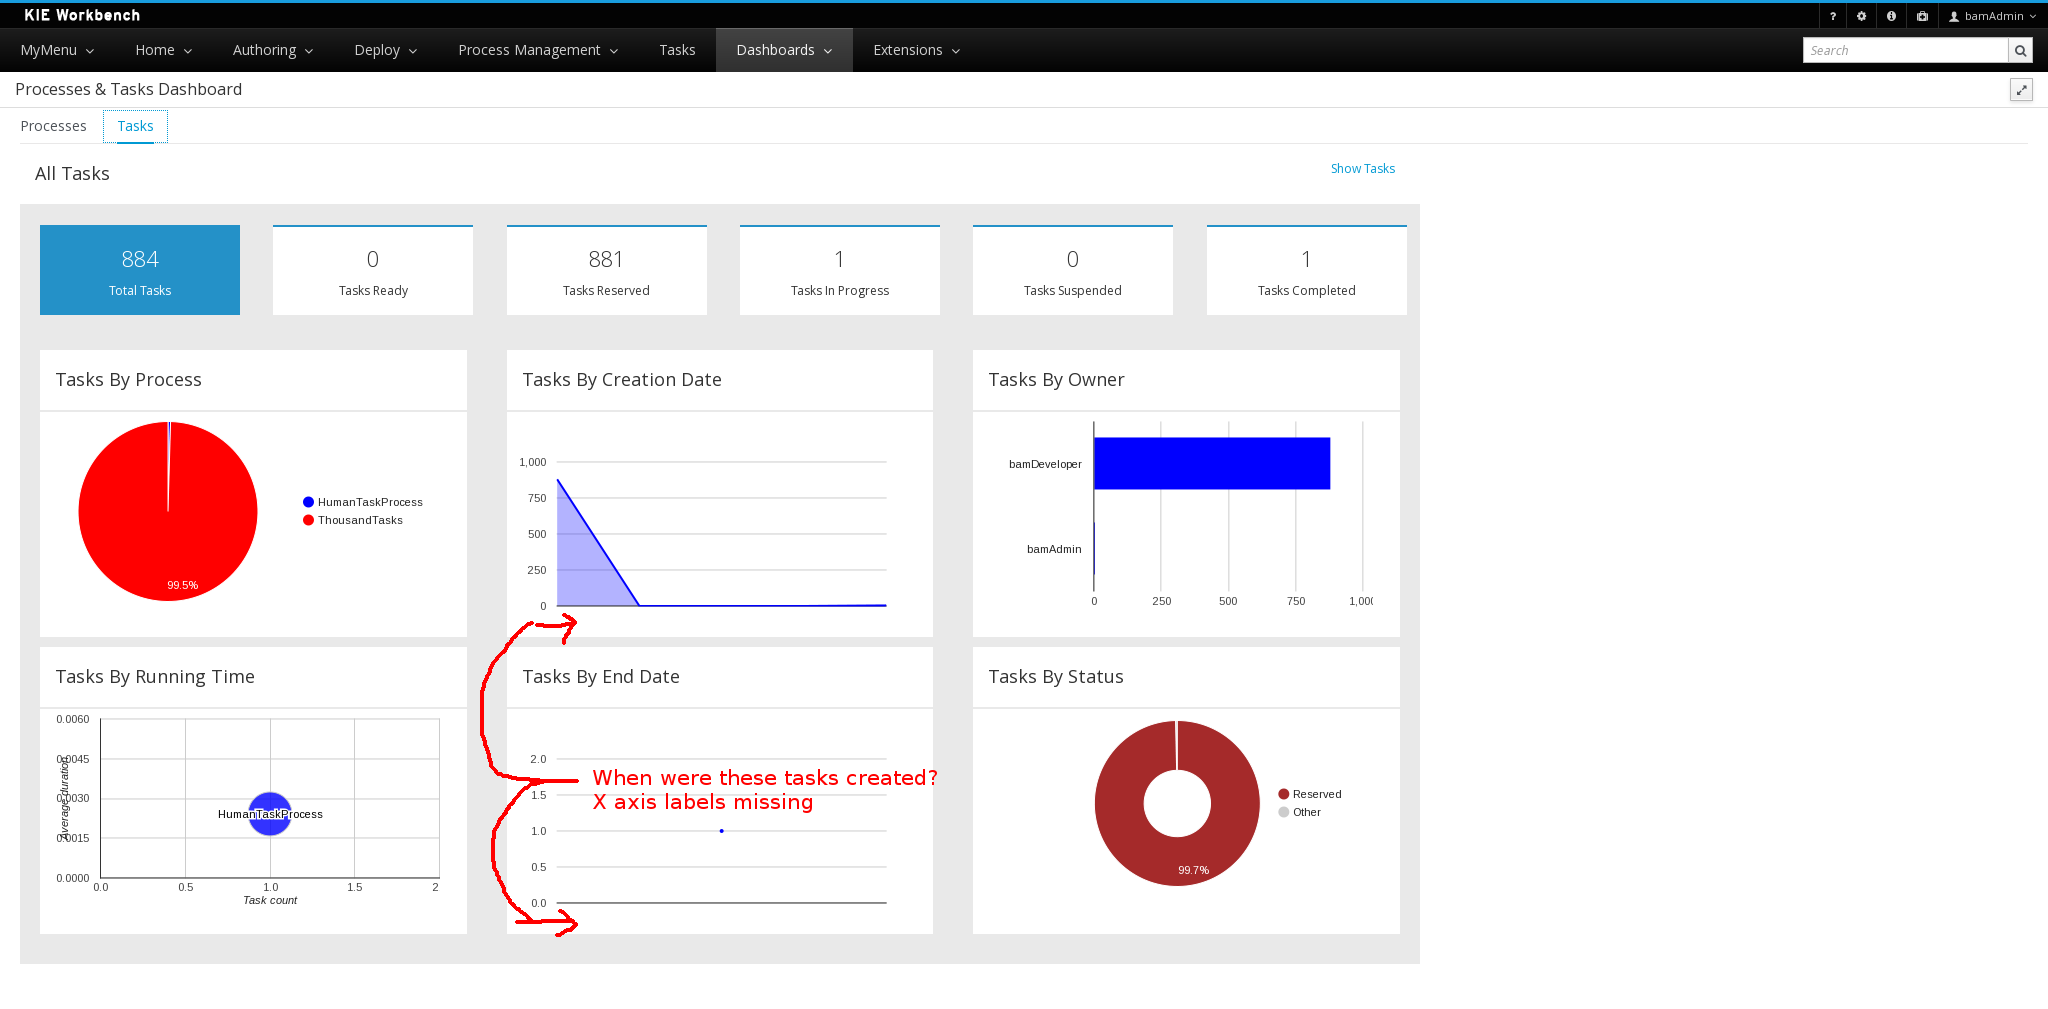
2. in Task dashboard
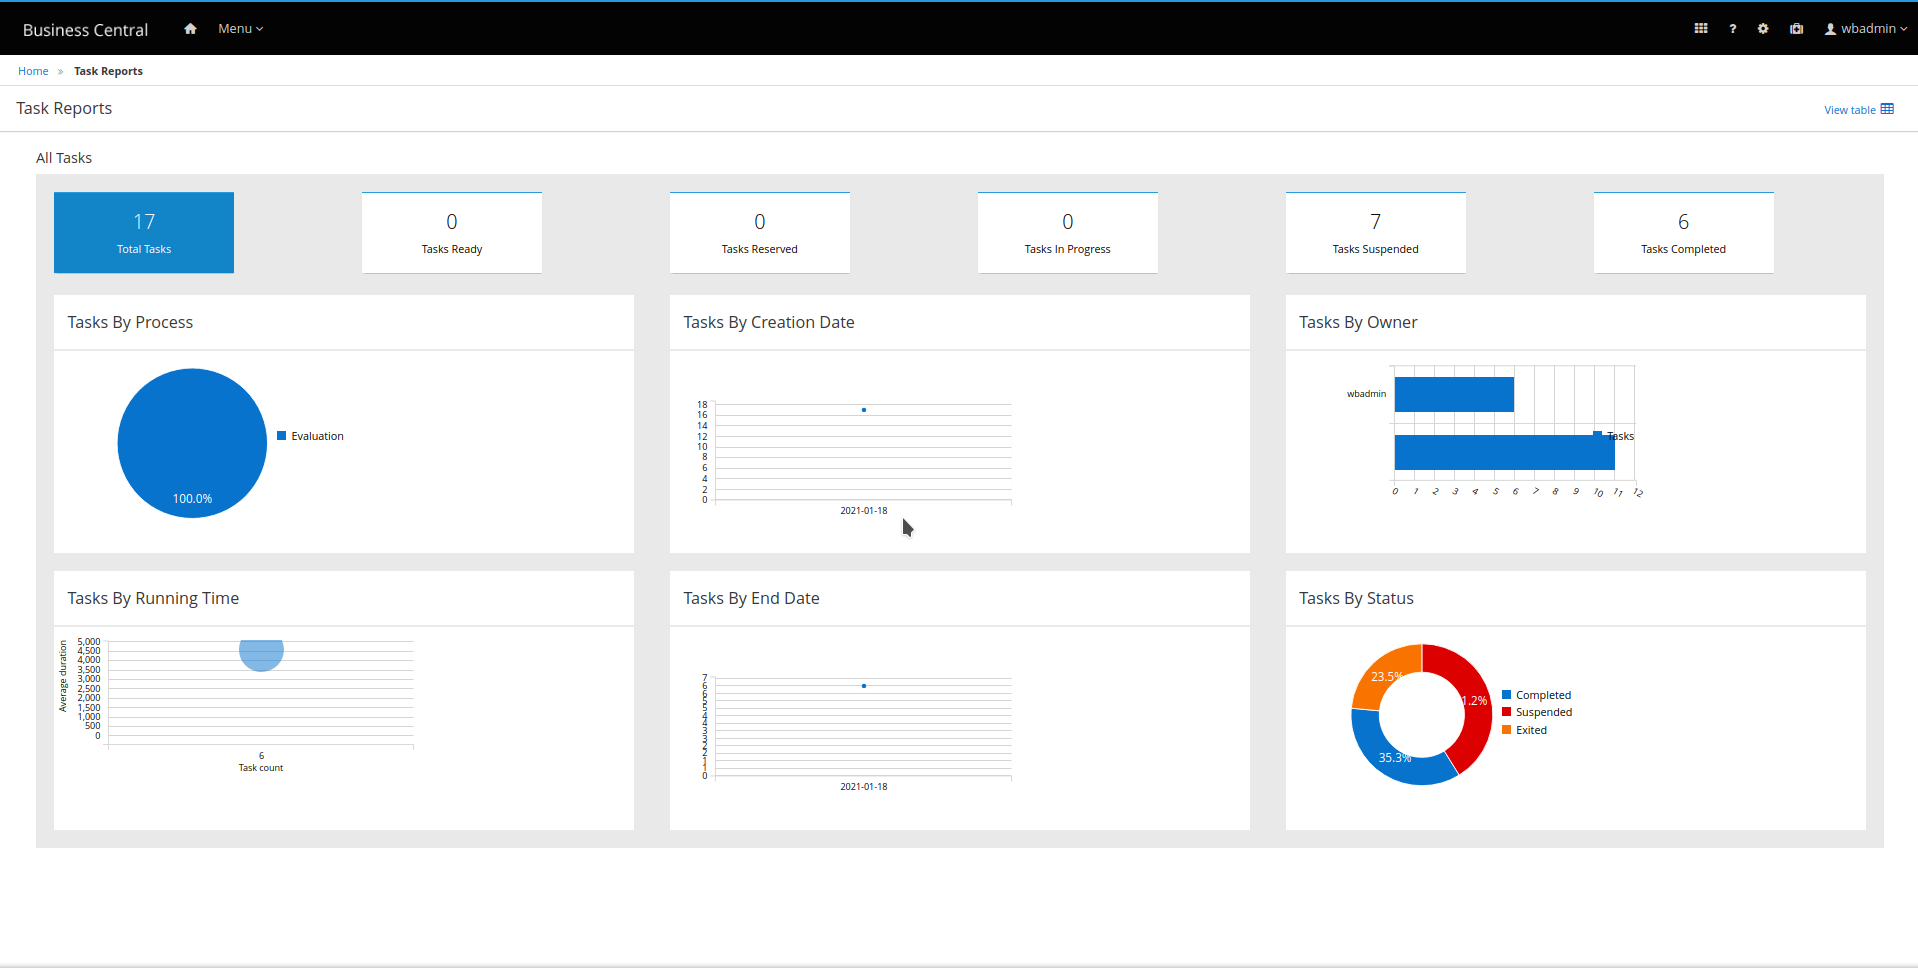
a. Tasks by creation date
b. Tasks by end date
In cases when lots of data is present it's not immediately clear which days have peaks Although it IS possible to mouse over the charts and see the popup bubble, I think it would be more convenient for users if the dates were shown as the X Axis labels.
Attachments
Issue Links
- is duplicated by
-
RHPAM-140 Process and Task Dashboards By Date Graphs Do Not Create Dates
-

- Closed
-
