Uploaded image for project: 'Hawkular'
  1. Hawkular
  2. HAWKULAR-738

[Charts] Support for forecast

    XMLWordPrintable

Details

    • Feature Request
    • Resolution: Done
    • Major
    • 1.0.0.Alpha8
    • None
    • User Interface
    • None

    Description

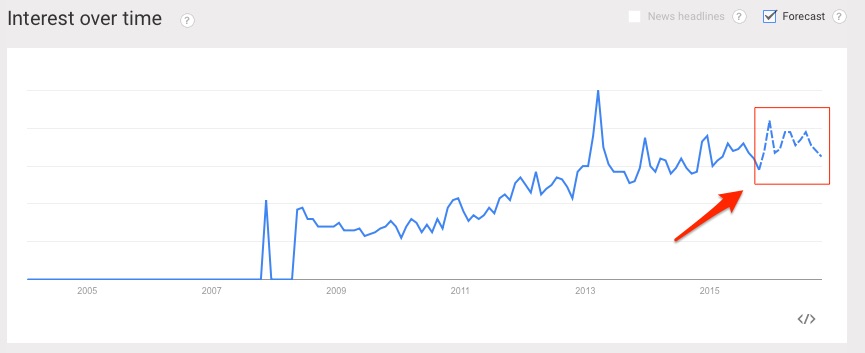
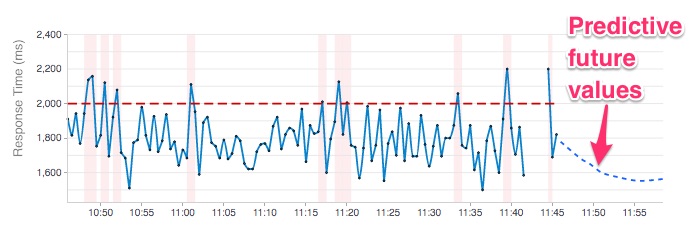
      Now It is impossible to show predicted curve in chart because it always goes through data and finds a min/max displayable for the all time series.

      It could support union in time values e.g. in the 90% of the graph show one curve and in the rest another.

      Attachments

        Activity

          People

            mithomps1@redhat.com Mike Thompson (Inactive)
            ploffay@redhat.com Pavol Loffay
            Votes:
            0 Vote for this issue
            Watchers:
            5 Start watching this issue

            Dates

              Created:
              Updated:
              Resolved: