Uploaded image for project: 'Hawkular'
  1. Hawkular
  2. HAWKULAR-213

Add Shaded areas for Metric Chart 'Out of Threshold'

    XMLWordPrintable

Details

    • Feature Request
    • Resolution: Done
    • Major
    • 1.0.0.Alpha2
    • None
    • User Interface
    • None

    Description

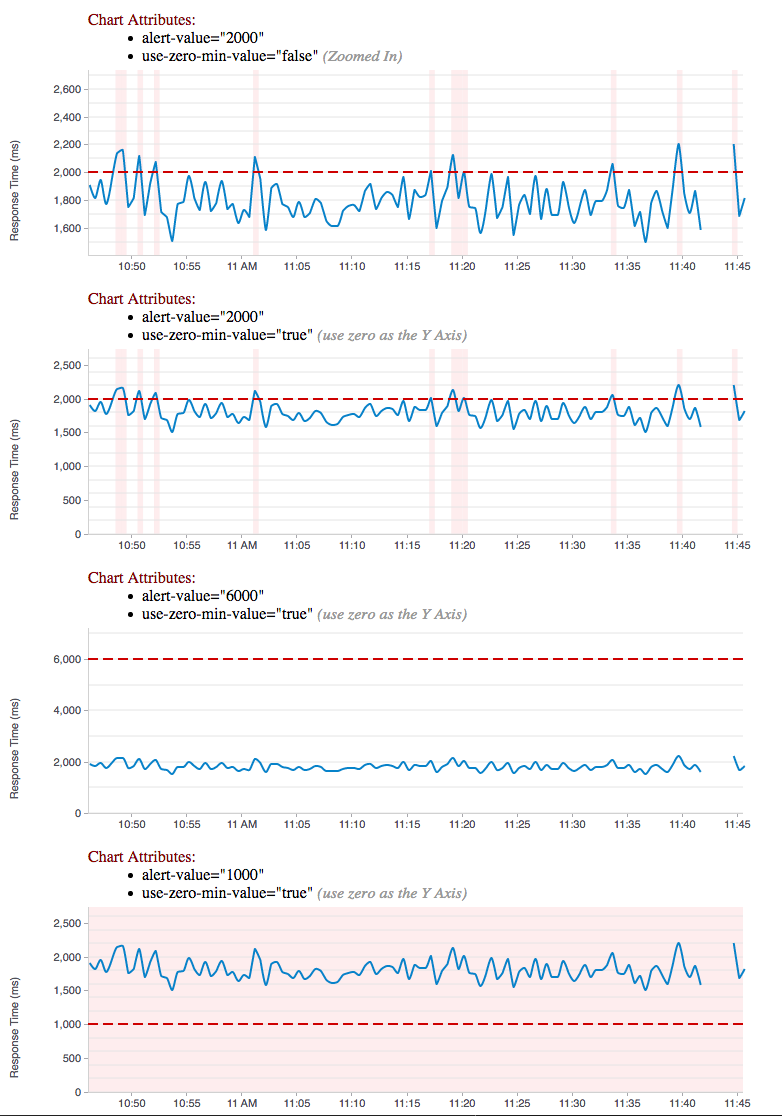
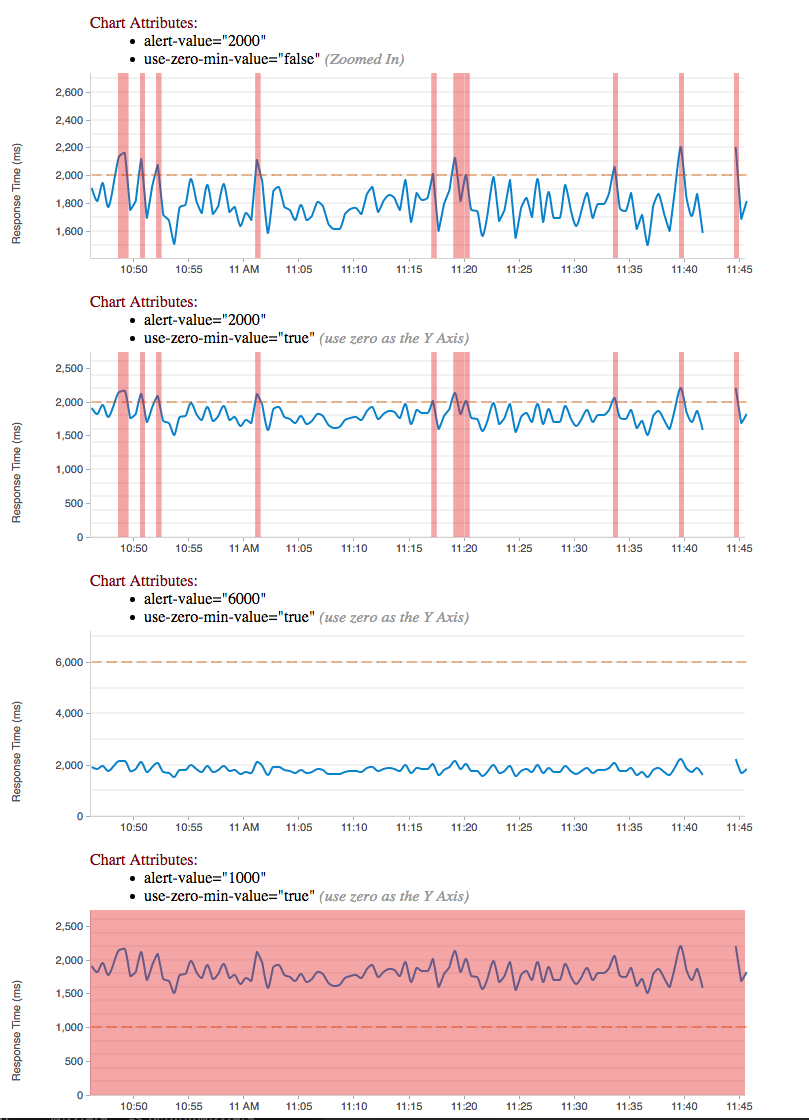
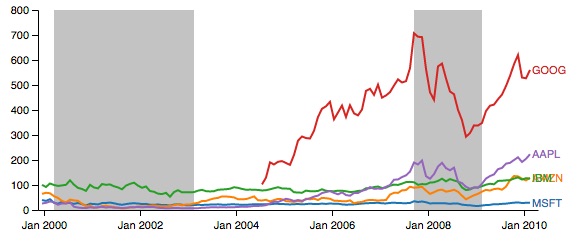
      Use shaded blocks to indicate 'OUt of Threshold' areas of the graph.
      See attachment, instead of gray use red with a transparency of about 50%.

      Attachments

        1. alert-area2.png
          alert-area2.png
          142 kB
        2. alert-areas.png
          alert-areas.png
          150 kB
        3. shaded_block.jpg
          shaded_block.jpg
          33 kB

        Activity

          People

            mithomps1@redhat.com Mike Thompson (Inactive)
            mithomps1@redhat.com Mike Thompson (Inactive)
            Votes:
            0 Vote for this issue
            Watchers:
            3 Start watching this issue

            Dates

              Created:
              Updated:
              Resolved: